We took a close look at charitable giving numbers in every part of Bexar County to find out who is giving their fair share.
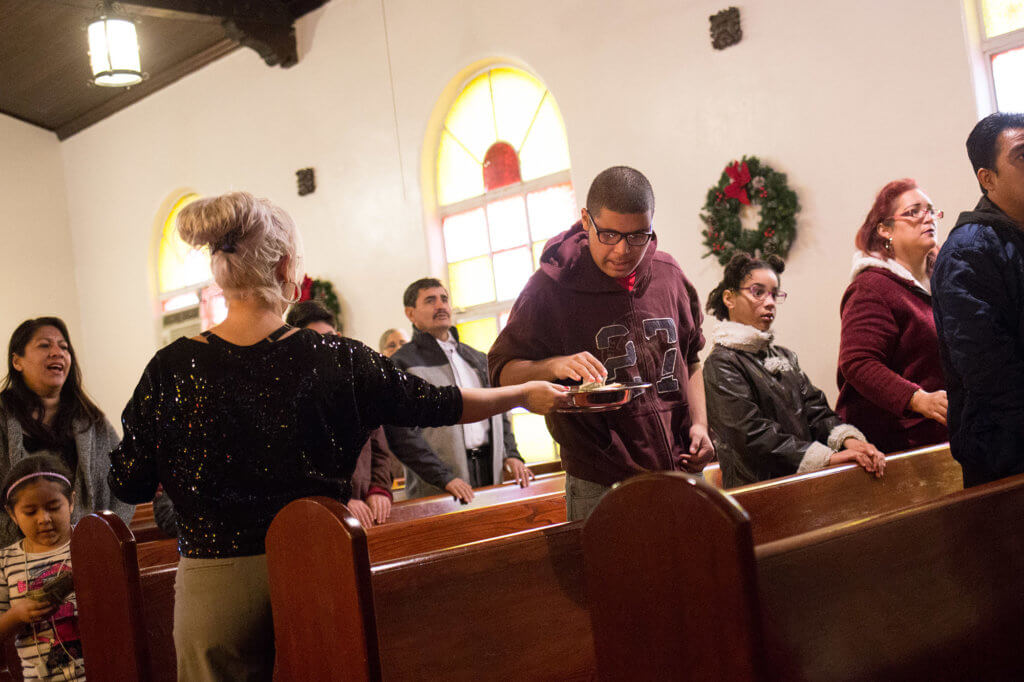
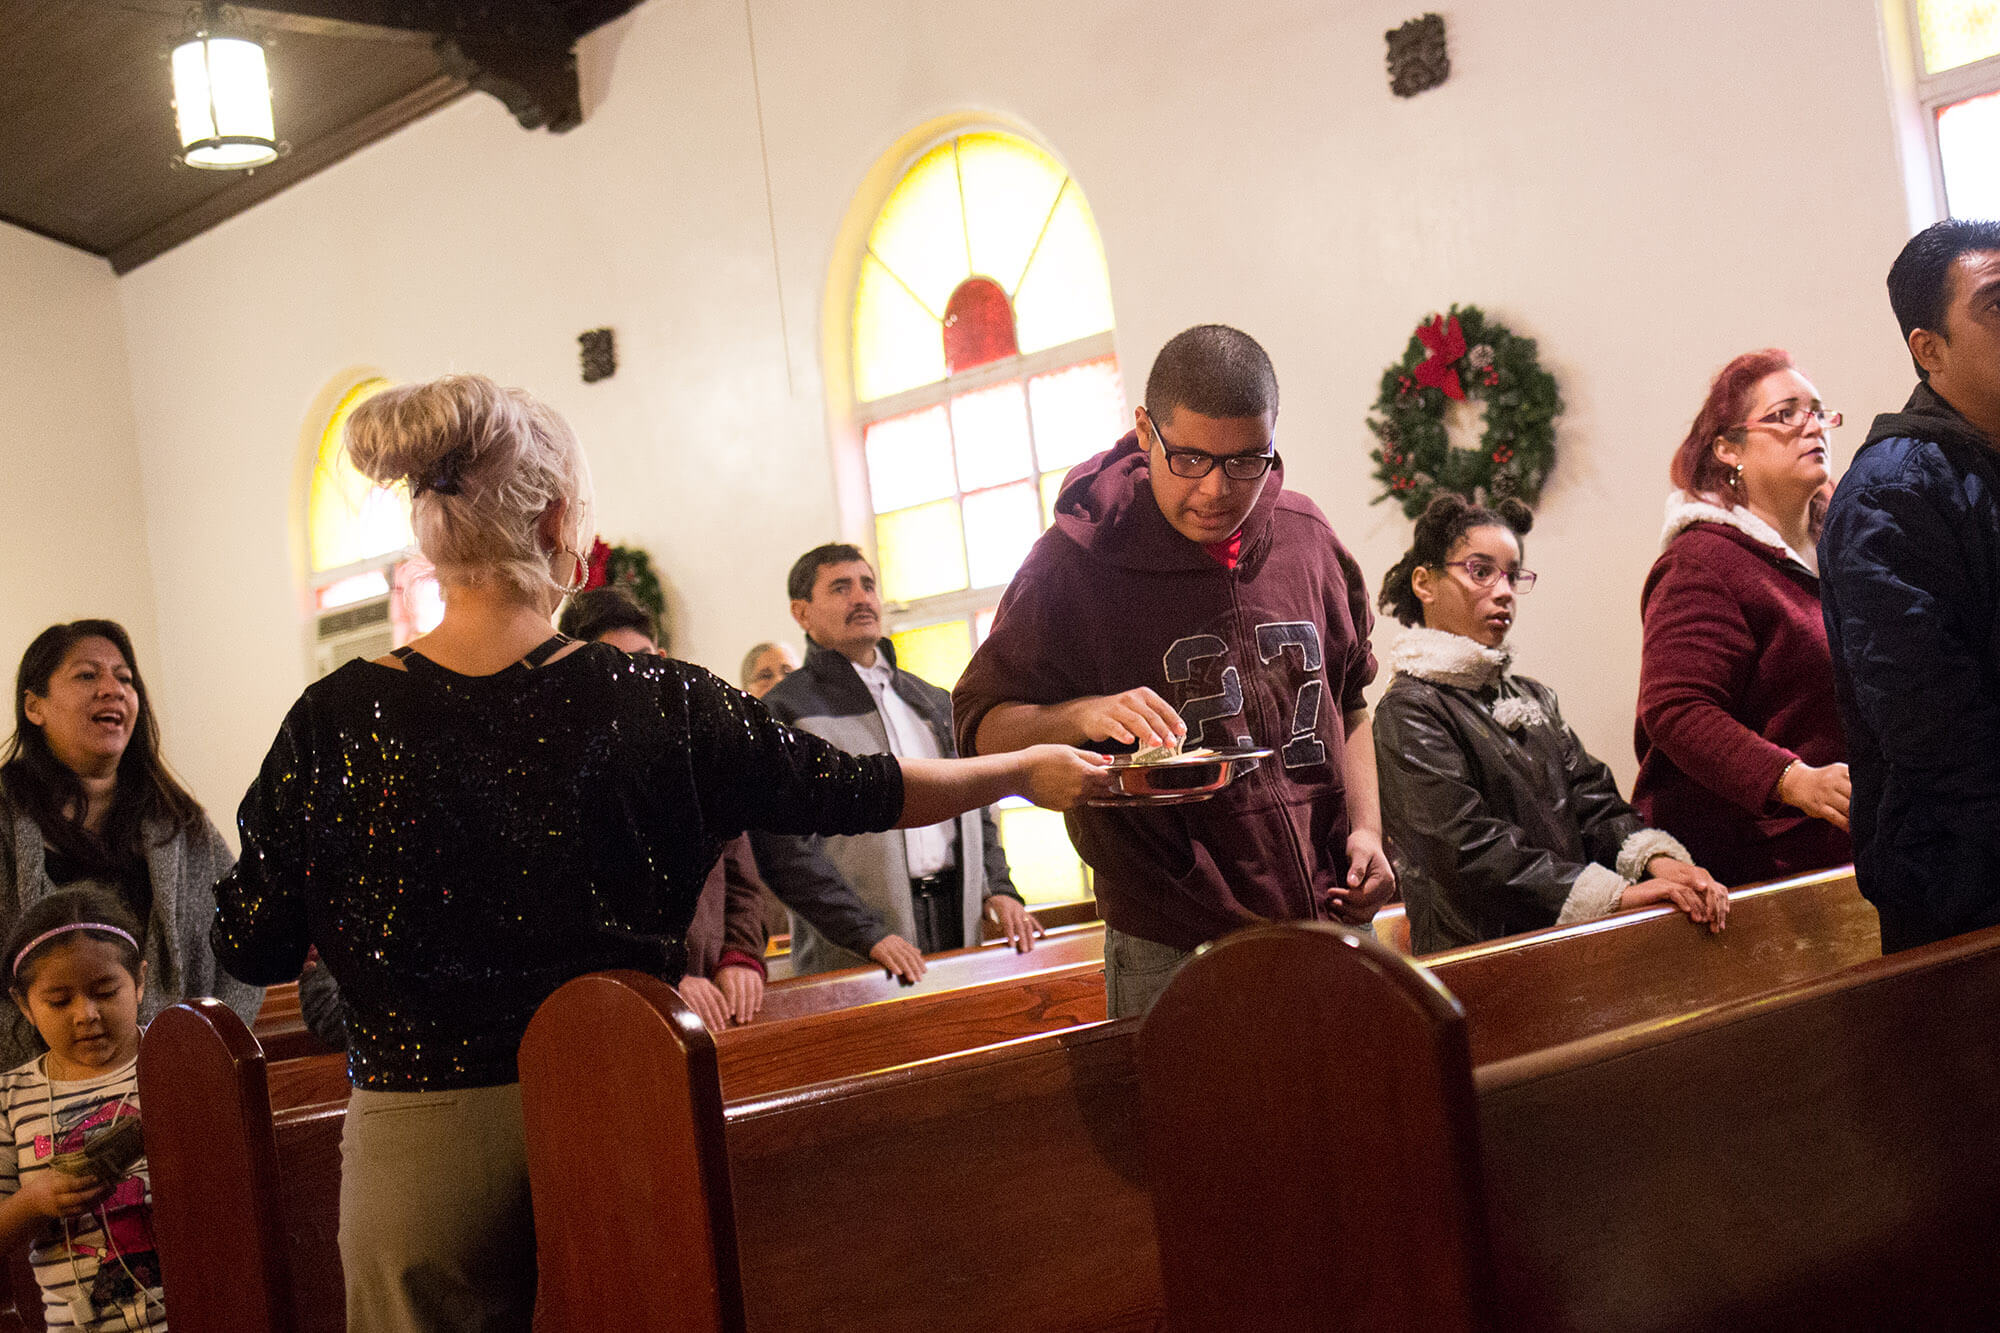
Janie Ray passes around the offering tray during the Primera Iglesia Cristiana New Years Eve service in the West Side neighborhood of San Antonio, Texas. Lynda Gonzalez | Folo Media
Editor’s Note: The data below has been updated so that it no longer includes ZIP codes that barely enter Bexar County’s borders. The article has been corrected to reflect the change.
Just before the new year, Spurs coach Gregg Popovich was asked why he prioritizes charity work. His answer was one he’s given before.
“We’re rich as hell, and we don’t need it all, and other people need it,” Popovich told ESPN. “Then, you’re an ass if you don’t give it. Pretty simple.”
Was Coach Pop on to something? If so, how is it going in his own backyard of Bexar County? After digging through thousands of lines of tax data from 2015, we found that wealthy people aren’t giving more than people of lesser means. That is consistent with a national trend.
Here’s a map that shows the spread of generosity in San Antonio and surrounding territories:

Keep in mind, we can’t measure what you drop in the Salvation Army buckets, and we can’t measure the meals you give to your neighbors. What this map shows is the giving ration for each ZIP code, meaning the percentage of money someone who itemized their taxes gave to charity compared to their gross itemizable income.
The range between the most and least generous giving rates is only about 4 percent, so it’s not like one ZIP code is giving substantially more or less than the rest. But many of the most affluent ZIP codes hover around the median rate, 3.64 percent. A report in the Chronicle of Philanthropy, an independent news organization based in Washington, D.C., criticized affluent areas for not exceeding the average donation rate. They have more resources and more spendable income, but are only just keeping pace with their lower-income brethren.
The most generous ZIP code, 78220, the far East Side, gave 6.53 percent of their income to charity, while the least generous, 78152, the St. Hedwig area, gave 2.53 percent. Neither is the richest or the poorest, nor the most or least populated. Nothing in the rest of the data explains why they are the most and least generous areas respectively.
What these ZIP codes do represent is the disparity that exists between ZIP codes that are near-neighbors geographically. The average donor in the far East Side (78220) makes $98,803, while the average donor in St. Hedwig (78152) makes $133,661.
In 78220, the median household income is $30,525, and in 78152, it’s $75,273, according to the 2012 – 2016 American Community.
Stone Oak residents, 78258, gave 2.71 percent of their average income of $102,665. The near West Side, 78207, gave 3.86 percent of their income, which on average is $24,766.
Bear in mind, 6 percent — or even 3 percent — of your income when you are just barely getting by is actually a larger portion of your disposable cash than if you are extremely wealthy.
To determine the giving ratio and total contribution amount, we used only the top four income brackets, because it is rare for individuals within the bottom two income brackets to itemize, meaning those who do are not representative of their brackets as a whole, according to Tyler Davis, data manager at the Chronicle of Philanthropy.
Throughout this piece, we reference the median household income, which comes from the 2012-2016 American Community Survey. We use this to give context about different ZIP codes’ economic conditions. The donors whose data is captured here make a significantly higher average income than the rest of their ZIP code, regardless of if they live in a rich or poor area.
This article was originally published by the H.E. Butt Foundation’s Folo Media initiative in 2017.