In its 2016 Distressed Communities Index, the Economic Innovation Group included a measurement called “spatial inequality.”
Spatial inequality measured how closely a zip code’s distress score was to a city’s average distress score. The distress score includes statistics of seven factors:
San Antonio led the nation in spatial inequality, with an inequality score of 23.7. Trailing San Antonio were Atlanta, Fort Worth, and Oklahoma City.
This score was calculated by taking the standard deviation of zip code distress scores within the city, weighting each zip code for its population.
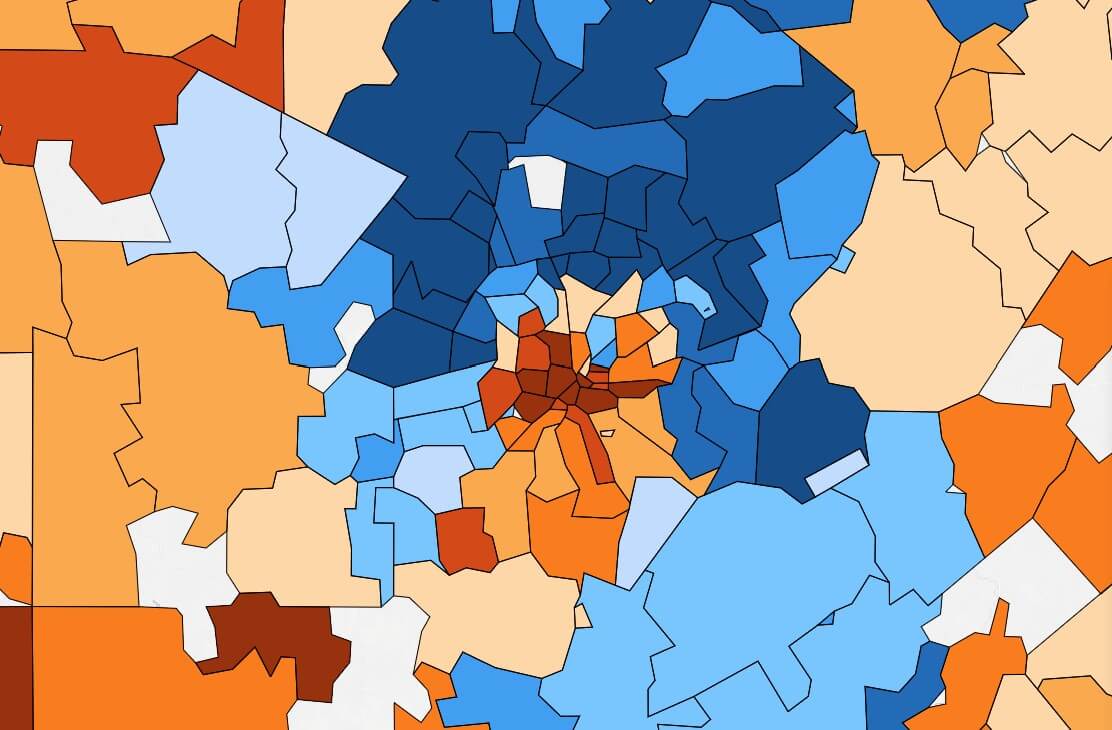
Use the embed below to browse zip codes in San Antonio by selecting to view Texas.
One key thing to note about this ranking is that it was based on official city boundaries. (Other studies measure inequality within metro areas, regional areas, or community zones). San Antonio has a long history of annexing newly developed suburbs, unlike more rigid cities like Detroit and Boston, whose wealthier citizens congregate outside of city limits. San Antonio’s inequality ranking may compare unfavorably to such cities.
Nonetheless, San Antonio’s zip codes vary tremendously in every measured statistic of distress, leading to a city with a clear geographic sense of prosperity.
The opinions expressed in this publication are solely those of Folo media and not necessarily those of The Economic Innovation Group. The Economic Innovation Group does not guarantee the accuracy or reliability of, or necessarily agree with, the information provided herein.